Charts and Tables
- PowerPoint Basics
- Presentation Designs
- Custom Presentations
- Adding Slides and Layouts
- Clipart
- Multimedia
- Charts and Tables
- Slideshow Animations
- Action Buttons
- Viewing the Finished Show
- Tips for Effective Presentations
Charts and tables can be added to PowerPoint slides to help organize and illustrate important information. There are several slide layouts that include a chart or table -- all you need to do is select that layout, then customize it to suit your own content. Alternatively, you may insert a chart or table from the Insert menu (see Custom Presentations for help with the Insert menu).
Charts and Graphs
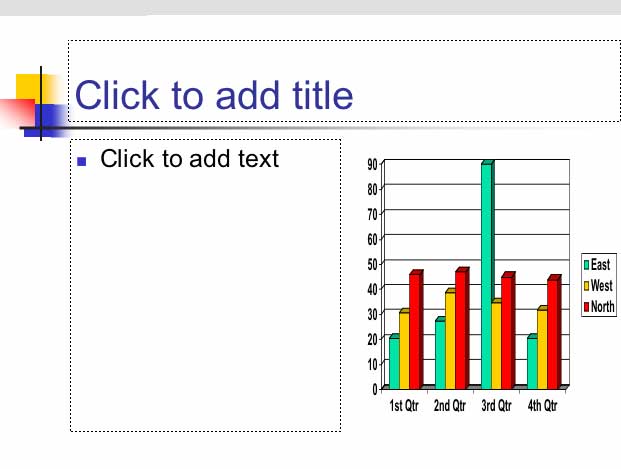
PowerPoint contains all of the tools necessary to create simple charts to illustrate data or particular points in your presentation. To insert a chart:
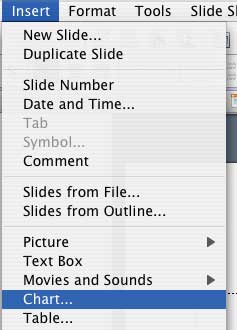
1. Click the Insert menu, then choose Chart. Alternatively, select a slide layout containing a chart and double-click the chart area to begin.
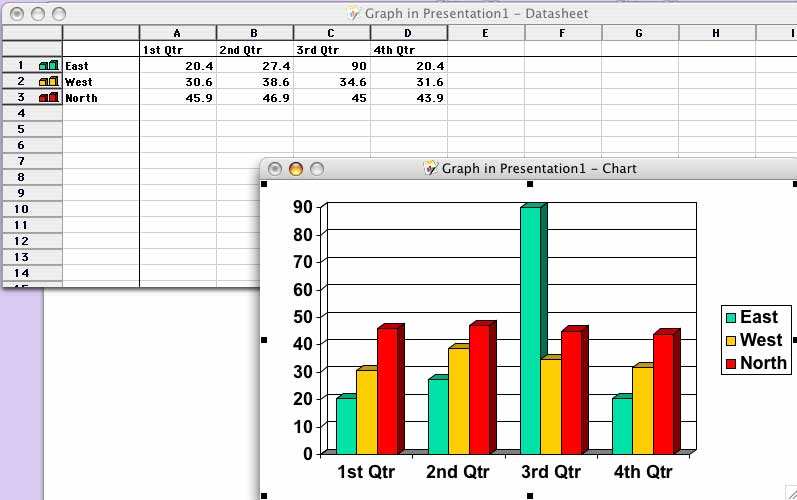
2. The helper program Microsoft Graph, which comes with PowerPoint, will open. Working with Graph is similar to working with a spreadsheet or table. Simply enter your information in the provided spaces, and the graph will redraw itself accordingly. Feel free to experiment with graph creation to achieve the effect you desire.
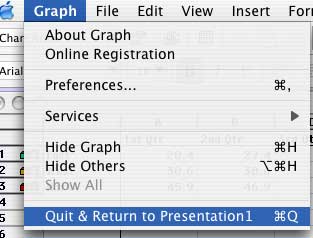
3. When you are finished, click the Graph (Mac OS X) or File menu (other platforms) to save your chart and return to PowerPoint.
4. Your chart will appear in your slide. You may double-click it to edit it further, resize it by clicking and dragging one of the squares that appear around the chart when selected, or you may click and drag the entire chart to another location in the slide.
Tables
Tables may be inserted into a PowerPoint slide to help organize or illustrate information for the viewer. Tables in PowerPoint are similar to tables in Microsoft Word.
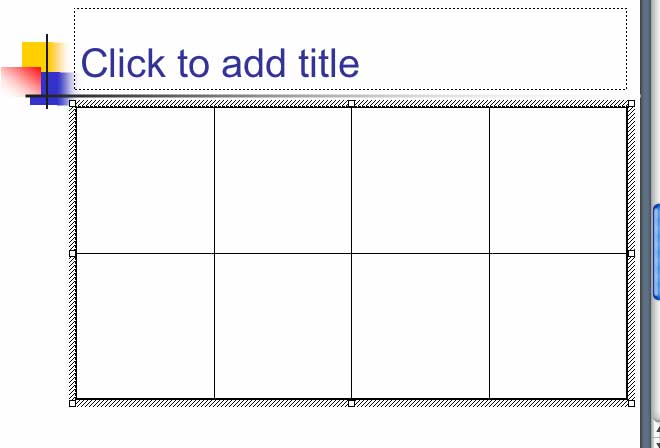
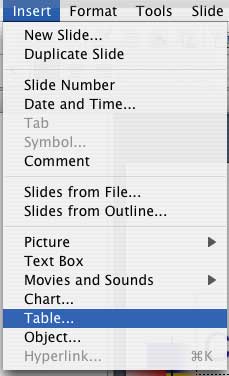
1. Insert a table by clicking the Insert menu, then choosing Table, or by selecting a slide layout which includes a table.
2. You will be prompted to select the number of rows and columns in your table.
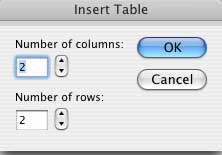
3. Click OK and your table will appear in your slide. Click in any cell to add text or graphics as you would normally.